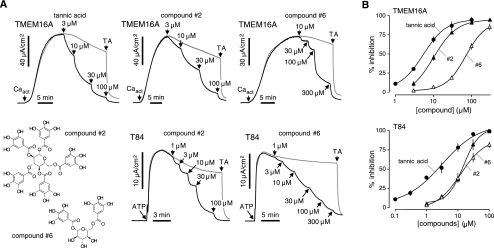
Figure 4.
Structure-activity analysis of tannic acid analogs. A) Representative short-circuit current data in TMEM16A-expressing FRT cells showing inhibition following activation of TMEM16A Cl− current by a small-molecule calcium agonist (Caact, 5 μM). Tannic acid or indicated analogs added as shown. Tannic acid (TA; 100 μM) was added where indicated. B) Dose-response data for inhibition of Cl− current in TMEM16A-expressing FRT cells (top panel) and T84 cells (bottom panel) (means ± se, n=3–4). Some error bars are smaller than symbol size. IC50 values are summarized in Fig. 3.

