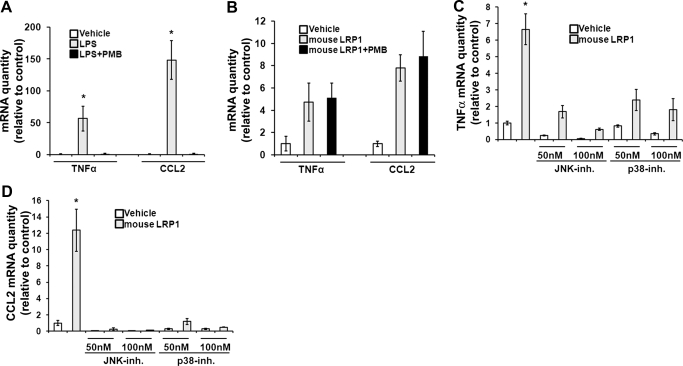
Figure 7. LRP1-induced cytokine expression results from activation of cell signaling.
(A) RAW 264.7 cells were cultured in SFM for 1 h and then treated with LPS (10 ng/ml) or with LPS that had been pretreated with PMB (50 μg/ml) for 1 h. Cytokine expression was determined by qPCR. (B) RAW 264.7 cells were treated with mouse LRP1 (25 nM) or with mouse LRP1 that was pretreated with PMB (50 μg/ml) for 1 h. Cytokine expression was determined. (C) RAW 264.7 cells were treated with mouse LRP1 (25 nM; shaded bars) or with vehicle (open bars) for 5 h in the presence and absence of inhibitors (inh.) of p38 MAPK or JNK, as indicated. TNF-α mRNA levels were determined. (D) The effects of inhibitors on expression of CCL2 were determined. All results were analyzed by the relative quantity (Ct) method (mean±sem; n=3; *P<0.05).

