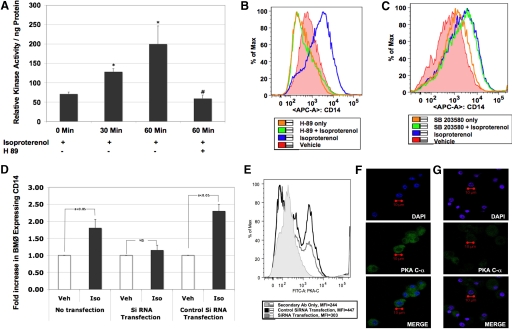
Figure 2. Isoproterenol acts via PKA.
Relative PKA enzyme activity by ELISA. Briefly, BMØ (106) stimulated with isoproterenol (1 μM) from 0 to 60 min, with and without H-89 (added 30 min prior to addition of agonist), were lysed immediately in the presence of protease inhibitors. The protein concentration in the cell lysate was determined using the BCA protein assay kit (Pierce). (A) Bar graph showing relative PKA activity/ng protein. Data are given as mean ± sem. *P < 0.05 versus 0 min; #P < 0.05 versus isoproterenol stimulation; n = 4. Histograms representing the MFI of CD14 expression in BMØ pretreated with H-89 (B) or SB203580 (C), 30 min before stimulating with isoproterenol. RNA degradation of PKA with siRNA transfection. BMØ were transfected with siRNA targeted to PKA C-α or control, scrambled siRNA. (D) Bar graph showing fold increase in CD14 expression on the y-axis and the different treatment groups on the x-axis. Data given in bar graph are mean ± sem. Confirmation of gene silencing. Veh, Vehicle; Iso, isoproterenol. (E) Histogram of PKA C-α protein expression following control and siRNA transfection resulting from FACS analysis. (F and G) Confocal images of BMØ showing nuclear staining (blue), PKA protein expression (green), and merge images with control transfection and siRNA transfection, respectively. A Zeiss LSM 510 confocal microscope was used. Original image resolution, 1024 × 1024; n= 4.

