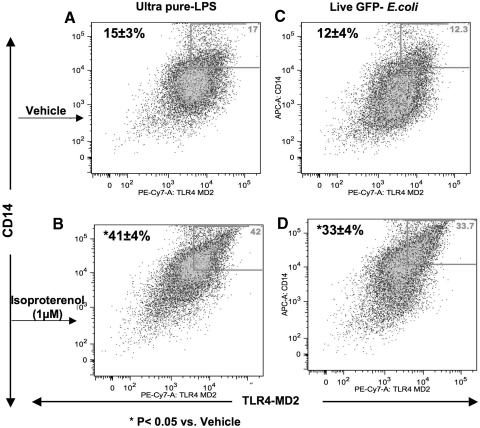
Figure 3. CD14/TLR4-MD-2 complex coexpression.
BMØ (106) were stimulated with isoproterenol or vehicle, washed, and treated with ultra-pure LPS or live E. coli for 30 min before labeling with F4/80-FITC, TLR4-MD-2-PE-Cy7, and CD14-APC mAb. Dot plots obtained from FACS analyses show those BMØ gated for F4/80+, expressing CD14 and the TLR4-MD-2 complex in the upper-right quadrants. (A) Vehicle + LPS; (B) isoproterenol + LPS; (C) vehicle + live E. coli; and (D) isoproterenol + live E. coli treatments, respectively. Data are given as mean ± sem. *P < 0.05 versus vehicle; n = 4.

