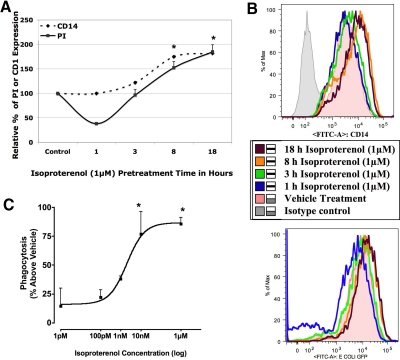
Figure 4. Time- and dose-dependent phagocytic response to isoproterenol stimulation.
(A) The graph shows the percent PI (solid line) to the time course of isoproterenol treatment (x-axis). Vehicle treatment is taken as 100%, and CD14 expression (dotted line) is shown alongside for comparison. (B) Histograms of MFI of CD14 expression (upper panel) and GFP-E. coli (lower panel) in BMØ treated with isoproterenol over the indicated time course. (C) The sigmoidal dose-response curve (variable slope) as a function of logarithm of agonist concentrations (for 18 h). Data are given as mean ± sem. *P < 0.05 versus vehicle; n = 4.

