
Figure 2.
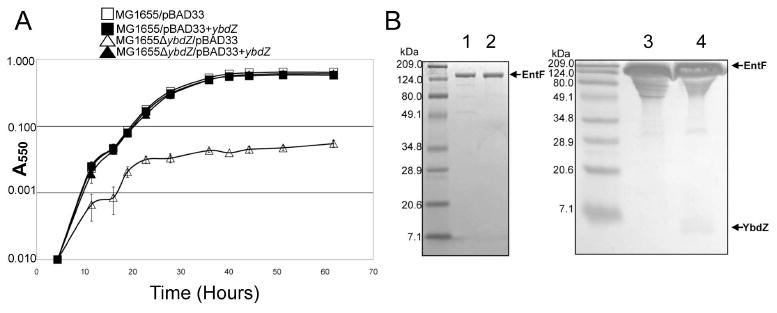
Analysis of ENT production in vivo and Purified EntF. (A) Growth curve comparing wild-type MG1655 to MG1655ΔybdZ with an empty vector (pBAD33) or vector expressing ybdZ (pBAD33+ybdZ). (B) Analysis of purified EntF-H6 overproduced in the presence or absence of YbdZ. 1 μg EntF (lane 1), 1 μg EntF+YbdZ (lane 2), 17 μg EntF (lane 3), 17 μg EntF+YbdZ (lane 4). 10-20% acrylamide gradient gel (left), 15% acrylamide gel (right).