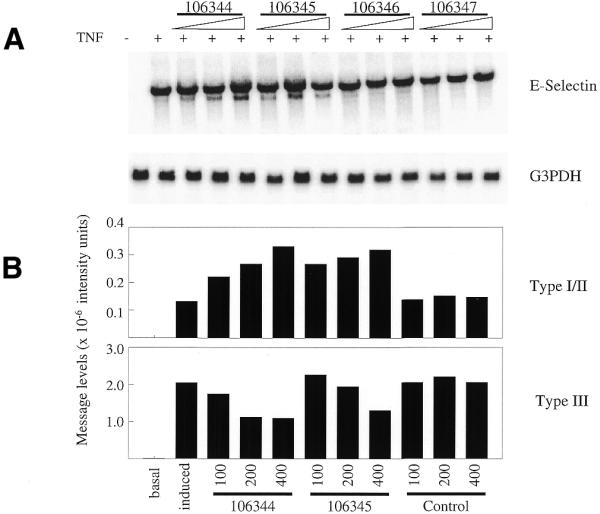
Figure 2.

Northern blot analysis of antisense-treated HUVEC. (A) HUVEC were oligonucleotide-treated with antisense oligonucleotides directed to the Type III E-selectin poly(A) signal and site or mismatch controls at doses of 50, 100 or 200 nM. E-selectin expression was then stimulated by the addition of TNF. Total RNA was isolated and analyzed by northern blot using an E-selectin probe. The blot was then stripped and probed for G3PDH RNA expression. (B) Following PhosphorImager scanning, intensity of E-selectin expression was accessed using ImageQuant software. Signals were normalized to corresponding G3PDH expression. Corrected image intensity levels of both the long (Type III) and short (Types I and II) messages are plotted.
