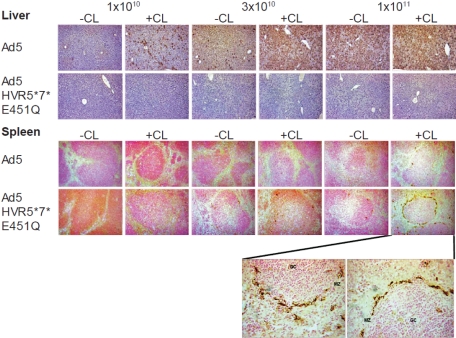
Figure 5.
Immunohistochemical analysis of liver and spleen sections. Immunohistochemistry of liver (top panel) and spleen (bottom panel) from macrophage-depleted (CL+) or control mice (CL−) 48 hours after the intravascular administration of 1 × 10¹⁰, 3 × 10¹⁰, and 1 × 10¹¹ vp of Ad5 or Ad5-HVR5*7*E451Q at low magnification (10×). Liver transduction was only observed for Ad5, while only Ad5-HVR5*7*E451Q efficiently transduced the spleen at high dose in macrophage-depleted mice. High power magnification (40×) of the spleen section at 1 × 10¹¹ vp of Ad5-HVR5*7*E451Q in macrophage-depleted mice is represented below spleen panel. MZ indicates marginal zone; and GC, germinal center.

