Figure 4.
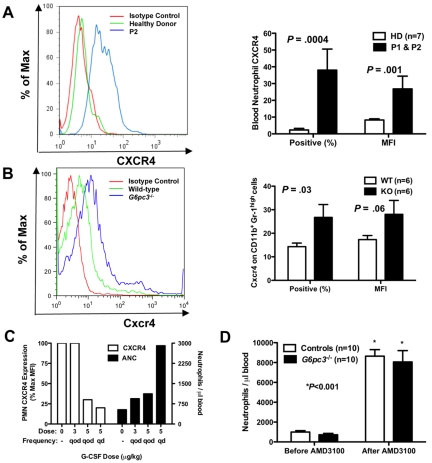
Neutrophil CXCR4 expression in human and mouse G6PC3 deficiency. (A-B) Flow cytometry (FACS). FACS was performed on freshly isolated neutrophils from (A) P1 (brother) and P2 (sister) or (B) freshly isolated bone marrow cells gated for size and CD11b+Gr-1high expression from G6pc3−/− mice, and compared with patterns found in healthy human donors and wild-type mice. Results are shown as representative histograms for patient 2 and for a knockout mouse in the left panels and are summarized as the percentage of CXCR4+ cells and as the MFI in the right panels of A (human) and B (mouse). Human data are from a single experiment performed before the patients were administered G-CSF. Mouse data are the summary of 3 separate experiments with 2 knockout and 2 wild-type mice in each experiment. (C) Effect of G-CSF treatment on neutrophil CXCR4 and ANC. Freshly isolated peripheral blood neutrophils were analyzed by FACS before and after starting G-CSF. ANC and CXCR4 expression on each dose were measured once for each subject after approximately 2 months on that dose. Data are summarized as the average of both subjects for each parameter at each dose and are presented on the same axes as percentage of maximum MFI (where maximum is defined as the MFI of the pre–G-CSF sample; left axis) and as the average ANC (right axis). (D) Effect of acute CXCR4 blockade on mouse ANC. G6pc3 knockout and littermate control mice (G6pc3+/+, n = 4 and G6pc3+/−, n = 6) were injected subcutaneously with 200 μg of the specific CXCR4 antagonist AMD3100. Absolute blood neutrophil counts per microliter were determined immediately before and 2.5 hours after injection. Data are from 2 experiments and are presented as the mean ± SEM.

