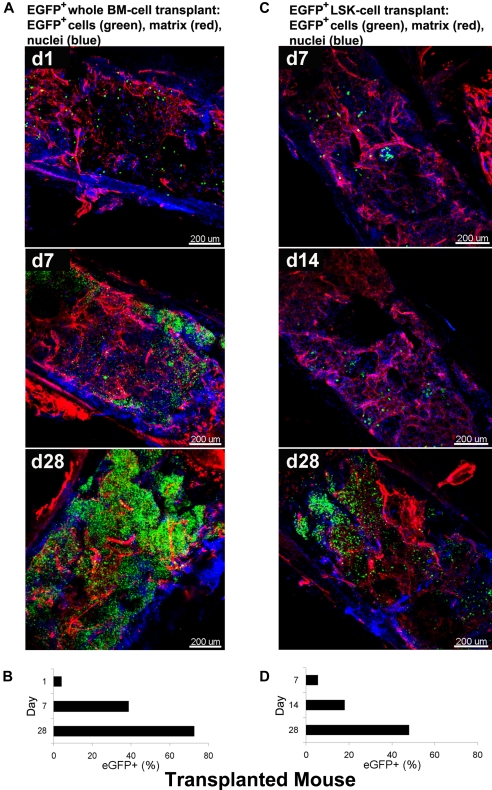
Figure 6.
Dynamic analysis of infiltration/expansion of EGFP cells in transplanted mice. Total BM or LSK cells were obtained from B6/EGFP mice expressing EGFP in all tissues and infused into B6 mice irradiated lethally, generating B6/tBM/EGFP or B6/LSK/EGFP mice. BM whole-mount specimens were examined at different time points by confocal microscopy (A,C) and isolated EGFP + hematopoietic cells were quantified by flow cytometry (B,D). (A) BM images of the B6/BM/EGFP mice on days 1, 7, and 28 illustrate: on day 1, massive destruction of extracellular matrix (red) and very few EGFP + cells (green) close to the bone edge; on day 7, remodeling of the extracellular matrix and increased number of EGFP+ cells, in islands beneath the bone edge; and by day 28, a complex network of extracellular matrix (red) and numerous EGFP+ cells evenly distributed. (B) Frequencies of EGFP-expressing cells in BM cells of the B6/BM/EGFP mice on days 1, 7, and 28 by flow cytometry. (C) BM images of the B6/LSK/EGFP mice on days 7, 14, and 28: at day 7, scarce clusters of EGFP+ cells appeared centrally located; at day 14, several clusters of EGFP+ cells were localized both centrally and peripherally, toward the bone edge; and at day 28, islands of EGFP+ cells were visible in the center of the tissue. (D) Frequencies of EGFP-expressing cells in BM cells of the B6/LSK/EGFP mice on days 7, 14, and 28, measured by flow cytometry. Nuclei were stained with DAPI. Scale bars are in micrometers. Related images appear in supplemental Video 7.

