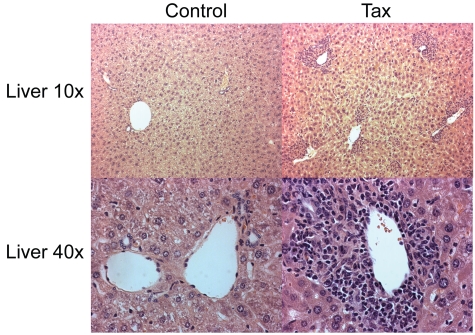
Figure 7.
Parenchymal lymphocytic infiltration in liver of LTR-Tax CD4+ T cell–recipient NSG mice. Histology of liver sections from NSG mice inoculated with LTR-Tax or control CD4+ T cells were analyzed by H&E staining (10-40× magnification). Micrographs were obtained using 10×/0.3 and 40×/0.6 objectives, as indicated, a Nikon EclipseTE2000-S microscope, Roper Scientific Photometrics imaging system, and Image Pro plus image acquisition software Version 4.5.0.29.

