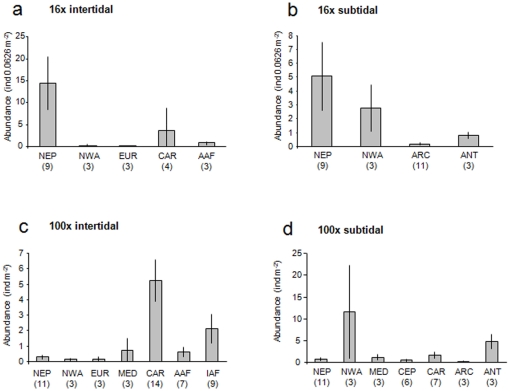
Figure 2. Average echinoderm abundances in ecoregions.
a. 16x intertidal collections, b. 16x subtidal collections, c. 100x intertidal collections, d. 100x subtidal collections. Numbers below ecoregions specify the number of sites included in each region. See Fig. 1 and text for ecoregions.

