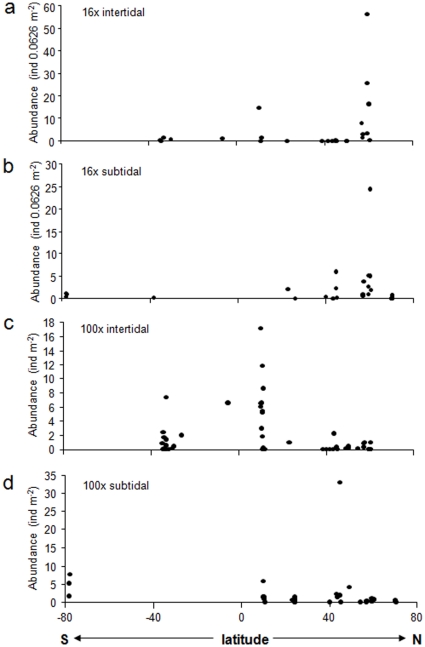
Figure 5. Spearman rank correlations between echinoderm abundance and latitude.
Echinoderm abundances are from a. 16x intertidal collections, b. 16x subtidal collections, c. 100x intertidal collections, and d. 100x subtidal collections. See Tables 1 and 2 for correlation coefficients and significance levels.

