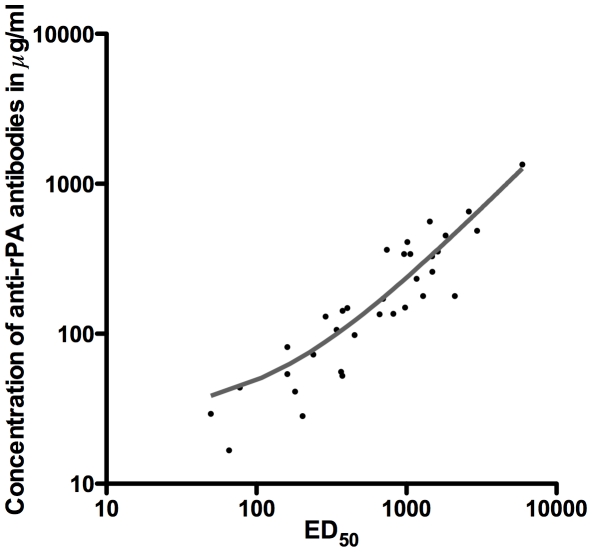
Figure 6. Correlation between the concentration of anti-rPA binding antibodies and the ED50 for the individual samples.
The plot depicts the relationship between the level of anti-rPA antibody binding and the neutralization ED50 in the TNA. A linear regression (grey line) indicates a strong correlation between the two parameters (R2 = 0.86). All samples from rPA recipients are included in the linear regression calculation, however, only the data that were above the limit of quantitation for both assays are displayed.

