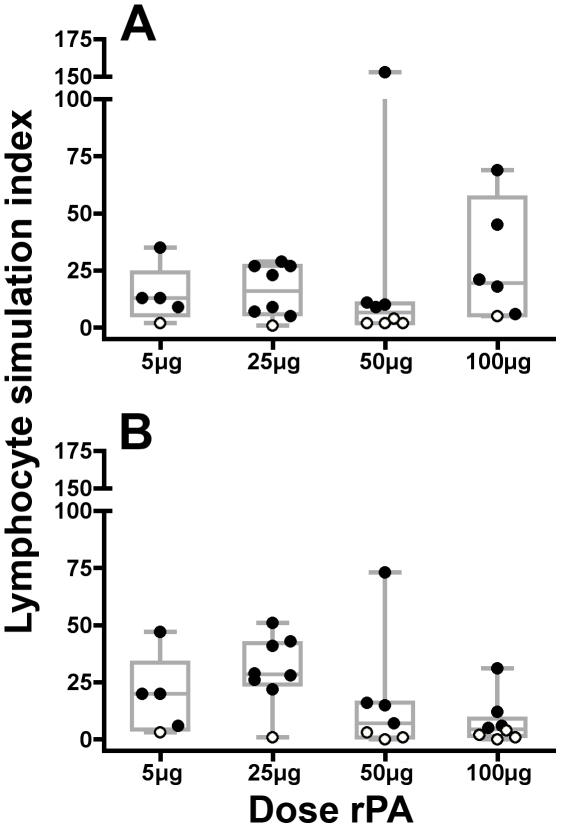
Figure 7. Vaccine induced lymphocyte proliferation.
The LPA was performed on fresh cells obtained the day of the assay from participants at study visit 8 (2 weeks post second vaccination) incubated with 1 µg/ml of rPA. The resultant lymphocyte stimulation index (LSI) is plotted for all rPA-receiving participants. The individual data points are overlaid on box and whiskers plots, which show the median and percentiles for the data within each group. (A) Individuals whom received rPA formulated without Alhydrogel® adjuvant (PBS). (B) Individuals whom received rPA formulated with Alhydrogel®. Negative values (LSI ≤5) are denoted by open circles.

