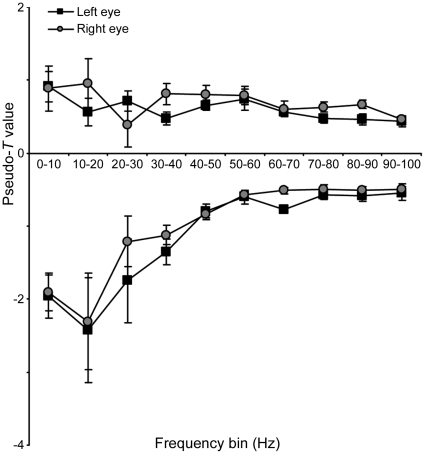
Figure 3. Largest energy changes in each 10 Hz frequency bin of SAM analysis.
For each of the SAM analyses, performed in 10 Hz frequency bins for 1 s pre- vs. 1 s post-onset of coherent structure in the Glass pattern, the mean (n = 8) of the largest negative and positive pseudo-T value observed in occipital cortex is plotted. Negative and positive pseudo-T values represent decreases and increases respectively in energy compared with baseline (viewing Glass pattern with random structure). Error bars represent one standard error of the mean.

