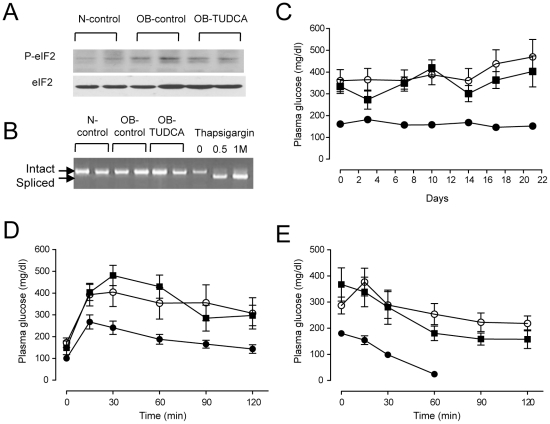
Figure 3. Effects of oral TUDCA treatment on ER stress and glucose homeostasis in ob/ob mice.
(A) Phosphorylated eIF2α expression levels are similar among groups. (B) Alternative splicing of Xbp1 was not detected in any of the three groups. The mRNAs isolated from thapsigargin-treated 3T3 L1 cells were used as controls. (C–E) There was no difference in fed-state blood glucose levels (C), glucose tolerance assessed by IPGTT (D), and insulin sensitivity assessed by ITT (E) between the OB-control and OB-TUDCA groups. Symbols and error bars represent means and SEM, respectively. (•), N-control; (○), OB-control; and (▪), OB-TUDCA mice.

