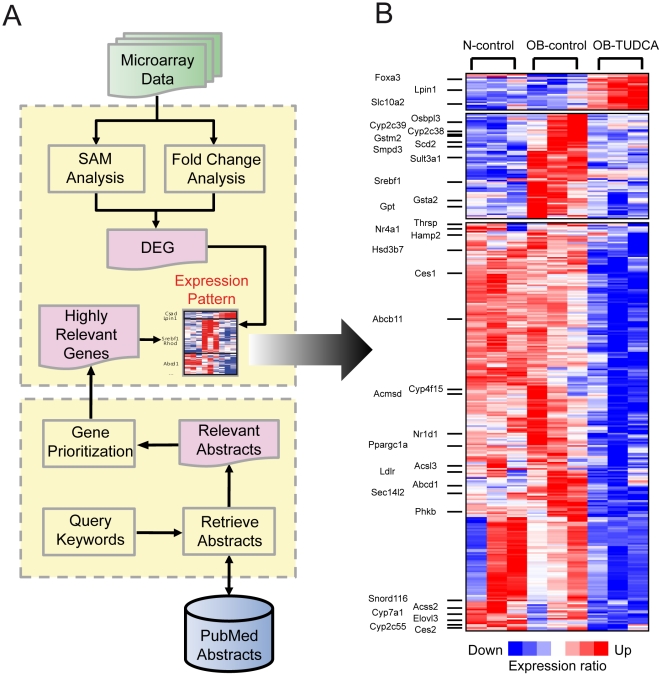
Figure 4. Changes in hepatic gene expression in OB-control and OB-TUDCA groups.
(A) Flowchart of DEG selection and relevant gene search. DEGs were selected using SAM and fold-change analysis. The relevant genes were selected using a PubMed database search. (B) The expression matrix shows the relative expression levels of DEGs for each condition. Each column of the matrix represents three experimental conditions: N-control, OB-control, and OB-TUDCA groups. Each row of the matrix represents relative expression data that were gene-wise normalized. Hierarchical clustering was conducted using the following parameters: Pearson correlation and single linkage method.

