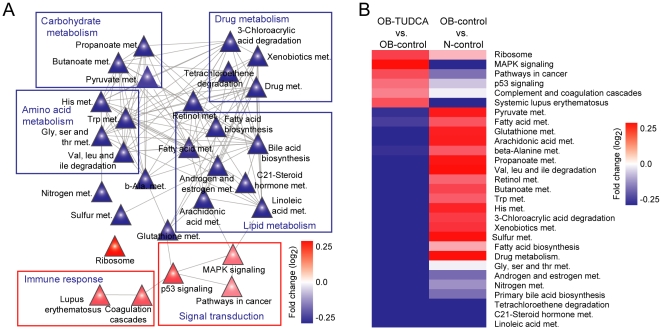
Figure 6. Relationships between altered pathways in the OB-TUDCA group.
(A) Abstract view of the pathway-pathway network; it shows the relationship among the pathways by connecting common genes. The colors of triangles represent the average changes in expression of genes involved in the pathway. (B) Average log2 fold-change expression pattern of DEPs in N-control vs. OB-control groups and OB-TUDCA vs. OB-control groups. Hierarchical clustering was conducted using the following parameters: Pearson correlation and single linkage method.

