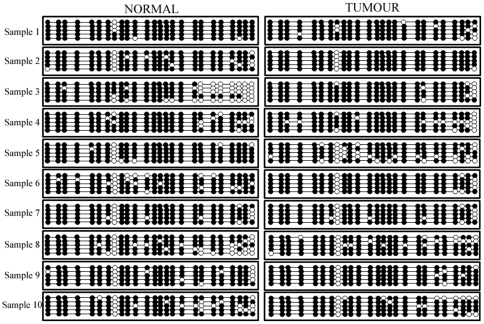
Figure 3. Both normal and tumour colonic tissue samples display methylation at sites in CpG2 island.
The dot diagrams report the methylation status at each of the 25 CpGs in the CpG2 island as assayed by sequencing multiple clones (n = 5) from matched normal (left panels) and tumour (right panels) samples from 10 patients (filled circle = methylated; white circle = unmethylated).

