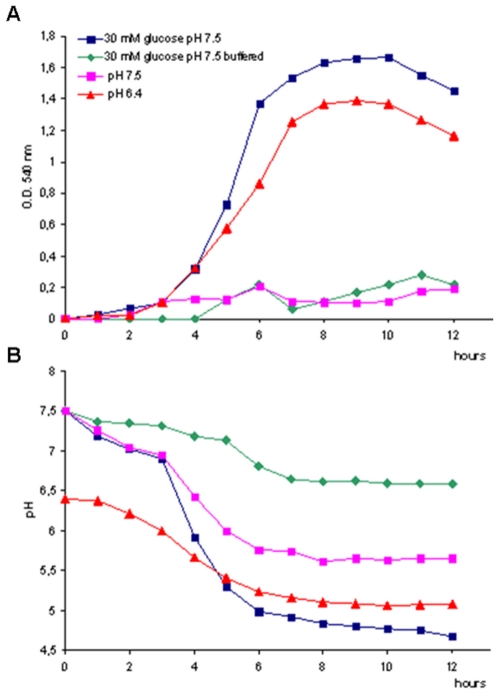
Figure 2. Effect of pH on the biofilm forming capacity of GAS FCT-3 isolate 43_M3.
A) Time-course biofilm plate assay using GAS strain 43_M3 (FCT-3) under four different growth conditions: non-buffered C medium pH 7.5; non-buffered C medium pH 7.5 supplemented with 30 mM glucose; buffered C medium pH 7.5 supplemented with 30 mM glucose; non-buffered C medium pH 6.4. B) pH variation in parallel experiments using 43_M3 (FCT-3) under the same growth conditions (colors matching those of panel A).

