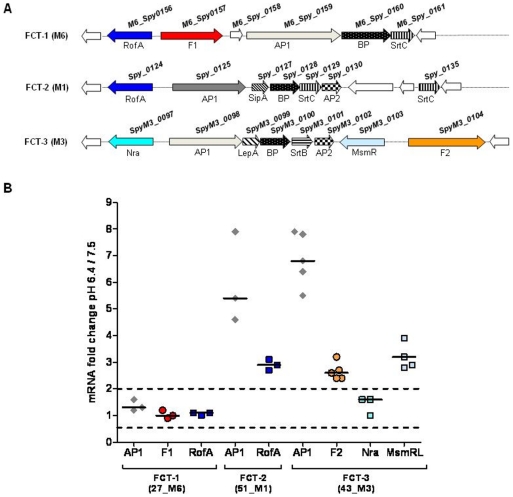
Figure 6. Transcript levels of FCT-1, FCT-2 and FCT-3 genes at different pH growth conditions.
A) Genetic organization of FCT-1, FCT-2 and FCT-3 regions. Transcription regulators are in blue, genes of the pilus operons in black-grey, and F proteins in red-orange. B) Relative transcript abundance of FCT encoded genes in strains 27_M6 (FCT-1), 51_M1 (FCT-2) and 43_M3 (FCT-3) grown up to OD600 of 0.4 in non-buffered C-medium at starting pH of 6.4 or 7.5 (gene colors match those of panel A); transcript abundance was measured using the housekeeping gene gyrA as a control; data are reported as mean value of at least three independent experiments performed with independently isolated RNA samples.

