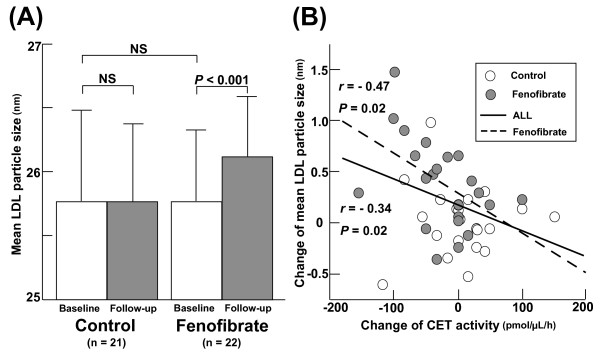
Figure 1.
(A) Comparison of the mean LDL particle size between the control and fenofibrate groups at baseline (white bar) and at follow up (gray bar). Bars represent the mean ± SD. (B) Correlation between mean LDL particle size and cholesterol ester transfer (CET) activity at baseline and at follow up in the control (white circle) group and fenofibrate (gray circle) group.

