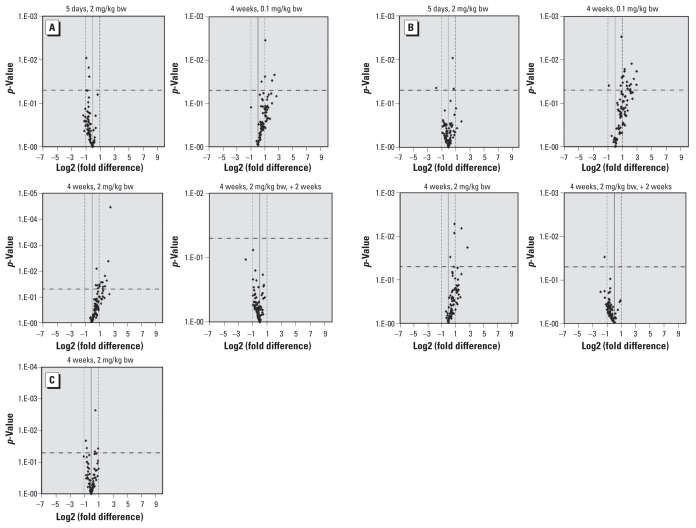
Figure 1.
Volcano plots of relative changes in the expression of genes related to apoptosis (A), cell cycle (B), and DNA damage (C) in liver from rats treated with furan at 0.1 or 2 mg/kg/bw for 5 days, 4 weeks, or 4 weeks plus a 2-week recovery period (n = 3 animals per treatment group). The solid vertical line indicates a relative change in gene expression of 1 (i.e., no difference in expression relative to untreated controls); dashed vertical lines indicate expression levels 2 times higher or lower than controls; and the horizontal dash-dot line indicates the threshold for p < 0.05. For a complete list of the genes evaluated in each group, see Supplemental Material (doi:10.1289/ehp.1002153).

