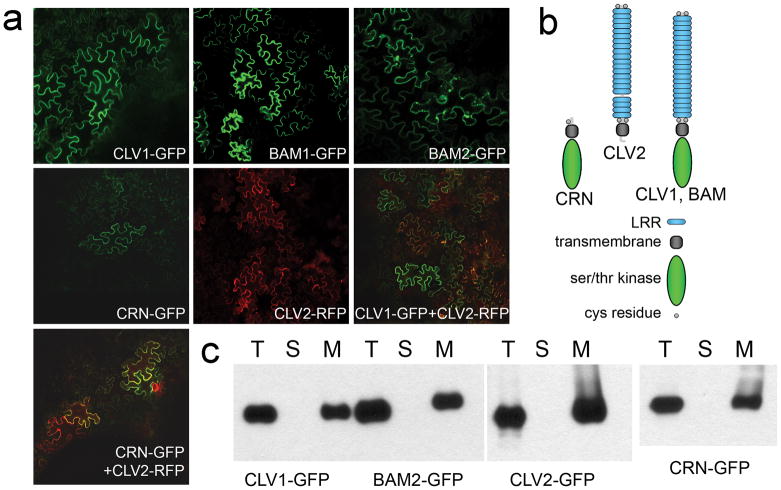
Figure 1. Localization of receptors expressed in N. benthamiana leaves.
(a) Confocal images of fluorescent-tagged receptors two days post-inoculation. Signal was primarily at the cell periphery, although some internal foci, perhaps corresponding to endocytosis, were observed. All infiltrations were done with the addition of the P19 co-suppression inhibitor (Voinnet et al. 2003).
(b) Shown are diagrams of the domain organization of proteins in this study.
(c) Total input (T) for each expressed protein was fractionated into soluble (S) and membrane (M) components and detected by protein gel blot analysis with anti-GFP antibodies.

