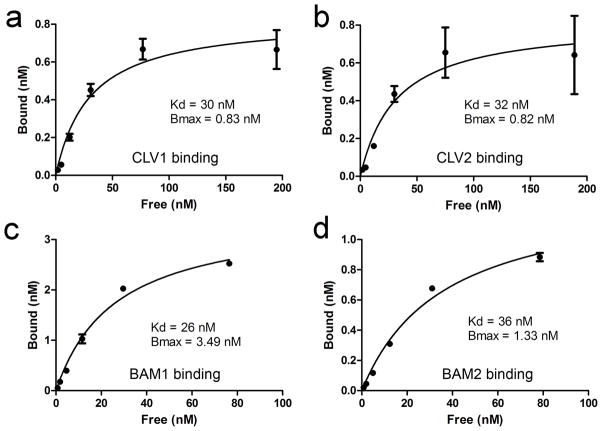
Figure 5. Kinetics of CLV3 CLE binding.
Saturation curves for CLV3 CLE binding from detergent-washed membrane fractions expressing CLV1-GFP (a), CLV2-MYC (b), BAM1-GFP (c), and BAM2-GFP (d) are shown. The mean ± standard error over three replicates are shown, as are the equilibrium dissociation constant (Kd) and total binding (Bmax).

