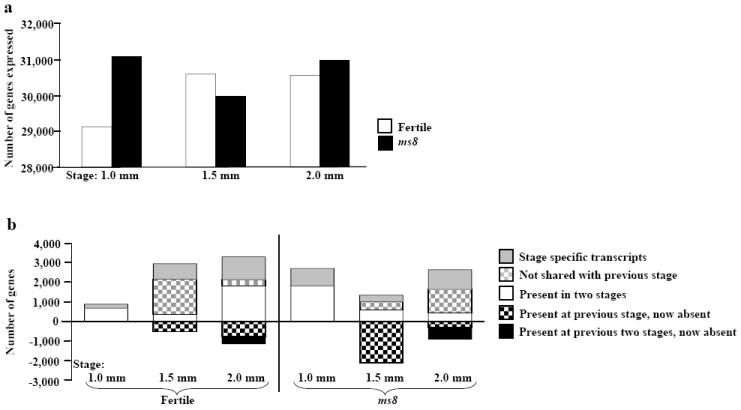
Figure 3.

Transcriptome analysis of ms8 and fertile siblings anthers. (a) Transcriptome sizes at three stages of ms8 and fertile siblings anthers. (b) Analysis of transcriptome changes during fertile (left part) and sterile (right part) anther development; 27,400 transcripts shared by all stages of fertile anthers and 27,284 transcripts shared by all stages of ms8 anthers are not shown. The y-axis of (a) shows the number of probes expressed, the y-axes of (b) show the number of probes; the x-axes list the developmental stages.
