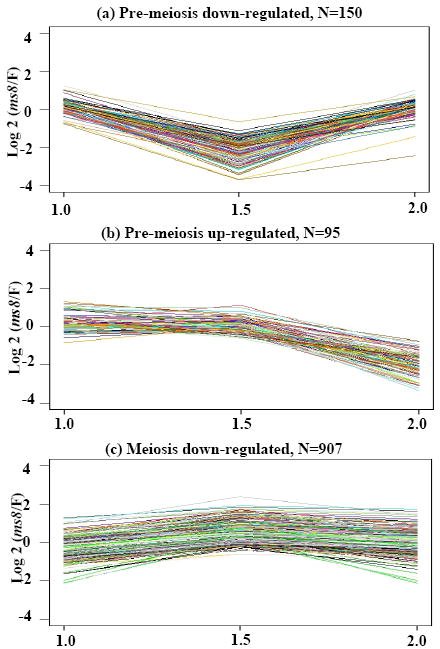
Figure 4.

Differentially expressed transcripts grouped by k-means clustering. Transcripts constitutively expressed in fertile plants were clustered, resulting in the ms8/Fertile fold change patterns shown. (a) 150 probes were down-regulated at the 1.5 mm stage; (b) 95 probes were down-regulated at the 2.0 mm stage; (c) 907 probes were up-regulated at 1.5 mm. The y-axes are the log2 ratio fold change of ms8/Fertile. The x-axes show the developmental stages.
