
Figure 7.
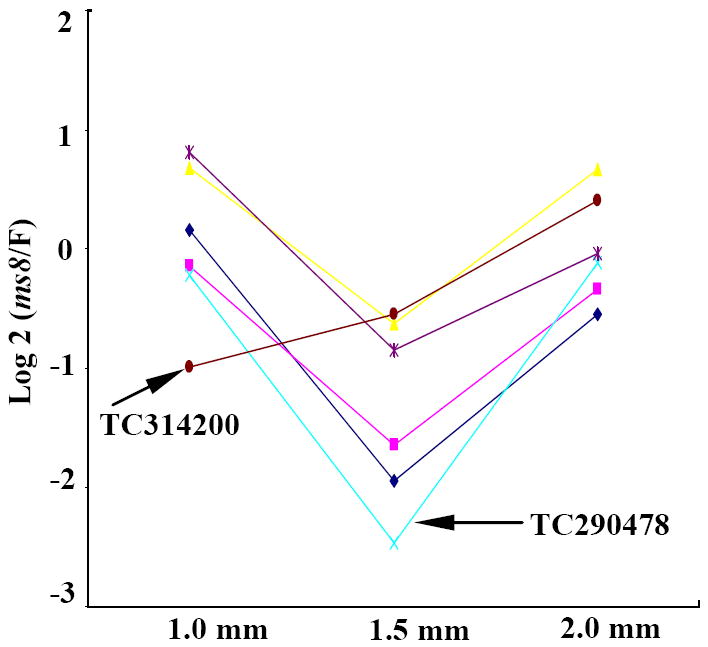
Expression comparison of potential cell layer markers. Fold change pattern of previously published potential tapetum markers (Ma et al., 2007), N=6. The y-axis is log2 (fold change). The x-axis shows the anther developmental stages.
Official websites use .gov
A
.gov website belongs to an official
government organization in the United States.
Secure .gov websites use HTTPS
A lock (
) or https:// means you've safely
connected to the .gov website. Share sensitive
information only on official, secure websites.
Expression comparison of potential cell layer markers. Fold change pattern of previously published potential tapetum markers (Ma et al., 2007), N=6. The y-axis is log2 (fold change). The x-axis shows the anther developmental stages.