Figure 1.
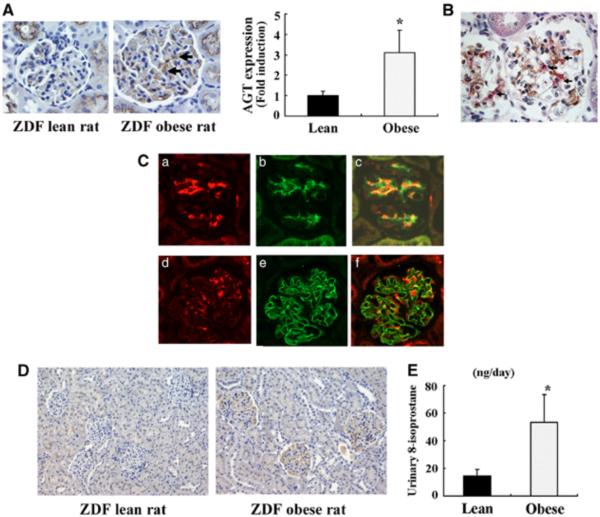
(A) Comparison of glomerular AGT expression levels between ZDF lean rats and ZDF obese rats at week 18. Representative photomicrographs of immunoreactivity for glomerular AGT in ZDF lean rats and ZDF obese rats at week 18. As the arrows indicate, it seems likely that the majority of glomerular AGT was expressed in mesangial cells. The immunoreactivity for glomerular AGT in ZDF obese rats was remarkably increased compared with that in ZDF lean rats. Original magnification: ×400. Semi-quantitative analysis of intensity of glomerular AGT immunoreactivity corrected for the size of glomeruli in ZDF lean rats and ZDF obese rats at week 18. Twenty glomeruli were examined for each rat and the averaged intensities of AGT immunoreactivity corrected for the size of glomeruli were obtained for each rat. The ratio was calculated relative to ZDF lean rat. *P<0.05 vs. ZDF lean rat. (B) Regions of glomerular AGT expression in ZDF obese rats as observed by immunohistochemical double staining. Representative photomicrograph of ZDF obese rats at week 18. Double staining was performed by IHC with an anti-AGT antibody (red) and an anti-Thy1.1 (a specific marker for mesangial cells) antibody (brown). As the arrows show, the majority of mesangial cells were double-stained. Conversely, as the asterisk shows, there was some minor staining that was observed in cells other than mesangial cells. Original magnification: ×400. (C) Regions of glomerular AGT expression in ZDF obese rats as observed by IF. Representative photomicrographs of ZDF obese rats at week 18 by IF. IF staining of AGT (red; a, d) was performed with either a mesangial cell marker—Thy1.1 (green; b)—or a glomerular epithelial cell marker—synaptopodin (green; e). The merged images show that AGT clearly localized in mesangial cells (c) and weakly in glomerular epithelial cells (f). Original magnification: ×400. (D) Comparison of glomerular 4-HNE expression levels between ZDF lean rats and ZDF obese rats at week 18. Representative photomicrographs of immunoreactivity for glomerular 4-HNE in ZDF lean rats and ZDF obese rats at week 18. Immunoreactivity for glomerular 4-HNE in ZDF obese rats was remarkably increased compared with that in ZDF lean rats. Original magnification: ×200. (E)Comparison of urinary 8-isoprostane excretion levels between ZDF lean rats and ZDF obese rats at week 18. Urinary excretion levels of 8-isoprostane in ZDF obese rats (n=6) and ZDF lean rats (n=5) at week 18. *P<0.01 vs. ZDF lean rats. AGT, angiotensinogen; 4-HNE, 4-hydroxy-2-nonenal; IF, immunofluorescence; IHC, immunohistochemitry; ZDF, Zucker diabetic fatty. A full color version of this figure is available at the Hypertension Research journal online.

