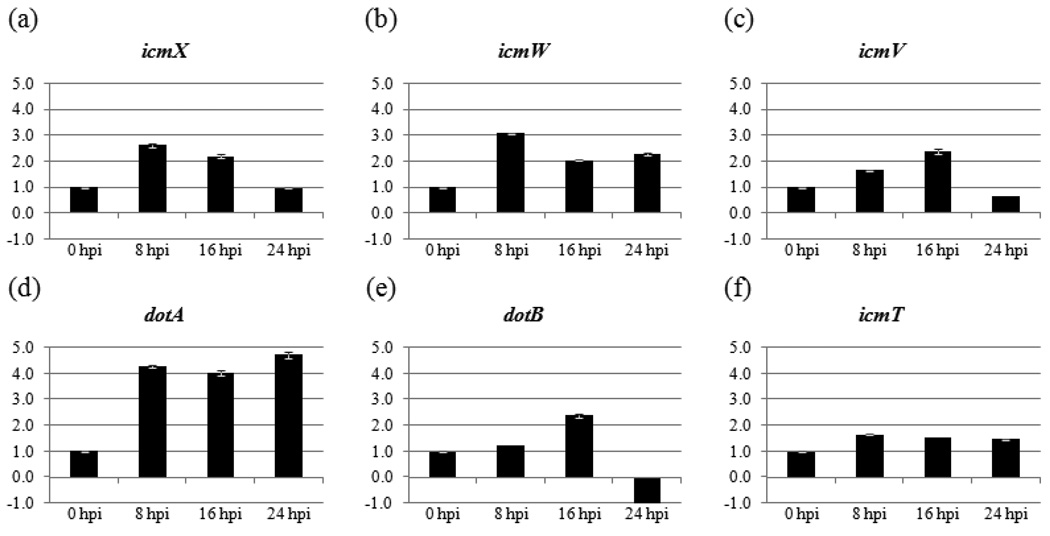
Fig. 3. C. burnetii icmX, icmW, icmV, dotA, dotB, and icmT transcript levels during the early stages of infection.
(a–f) Fold changes in mRNA levels relative to 0 hpi. An equal amount of total RNA from each sample was analyzed by RT-qPCR. The time (in hpi) when total RNA was harvested is indicated below the X-axis. Results represent the mean of three biological samples with no fewer than three technical replicates of each sample. Standard error bars represent the combined standard error of the mean (S.E.M.) per time point.

