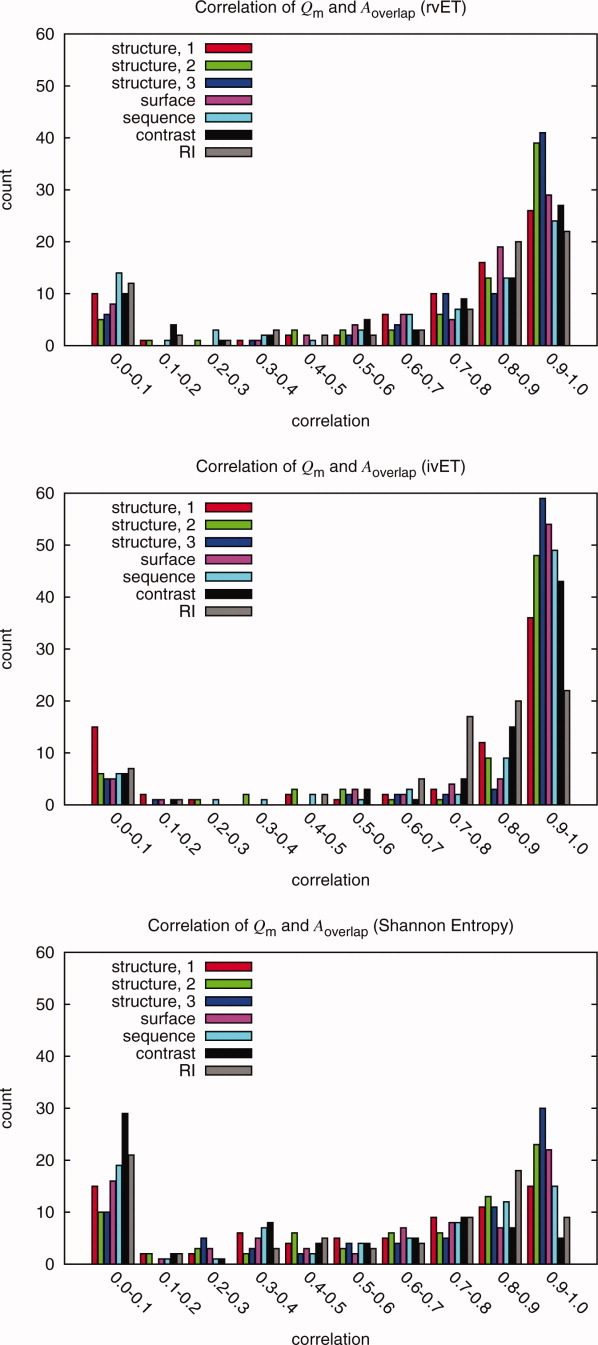
Figure 5.

To test ranking methods and quality measures, random mutations were inserted into the alignment. These histograms show the correlations of the possible quality measures and functional site measure Aoverlap for the rvET, ivET, and Shannon Entropy method. The Qstructure,2 and Qstructure,3 measures consistently have the best correlations in all three methods for the majority of the proteins. All measures were shown to have some correlation. The Shannon Entropy and the rvET methods had a significant number of proteins with low correlation when compared to the ivET method. This is because ivET is very sensitive to errors while the other methods are more resilient. Thus, as errors were added, ivET rapidly lost accuracy and showed better correlations than the two other, more robust methods for which the overlap with the known site would not change dramatically up until the alignment had 20% error. Though this decreased correlation may impair optimization, it is desirable for good initial functional site prediction.
