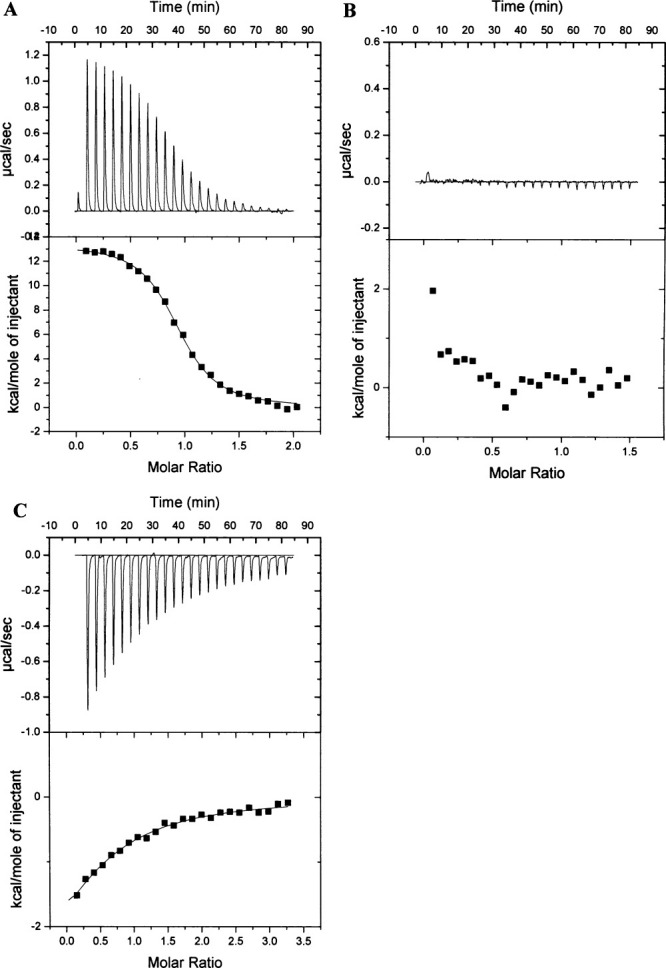
Figure 7.

Typical ITC data for the endothermic binding of NmrA to the AreA Zinc Finger and the exothermic binding of NAD+ to FNM1B+C-term at 25 (C. (A): (Upper panel): Heat uptake upon injection (1 x 2 μL and 24 x 10 μL) of NmrA (300 μM) into the calorimetric cell (1.4 mL) containing AreA663–727 (28 μM). Heat pulses in the absence of AreA663–727 (not shown) were negligible. (Lower panel): Integrated heat pulses, normalized per mole of injectant, giving a differential binding curve that is adequately described by a single-site binding model; (B): (Upper panel): Heat uptake upon injection (1 x 2 μL and 24 x 10 μL) of FNM1B+C-term (200 μM) into the calorimetric cell (1.4 mL) containing AreA663–727 (25 μM). Heat pulses in the absence of AreA663–727 (not shown) were negligible. (Lower panel): Integrated heat pulses, normalized per mole of injectant; (C): (Upper panel): Heat uptake upon injection (1 x 2 μL and 24 x 10 μL) of NAD+ (2 mM) into the calorimetric cell (1.4 mL) containing FNM1B+C-term (112 μM). Heat pulses in the absence of FNM1B+C-term (not shown) were negligible. (Lower panel): Integrated heat pulses, normalized per mole of injectant, giving a differential binding curve that is adequately described by a single-site binding model.
