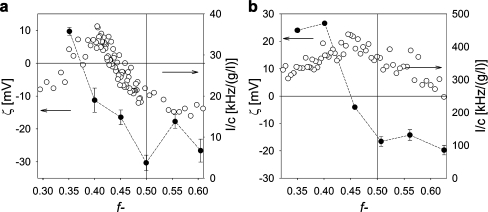
Fig. 5.
Formation of GICs in bulk as determined with DLS titrations and zeta potential measurements. Left Y axis zeta potential, right Y axis scattering intensity [kHz] divided by the total concentration, c [g/l], of the polymer. (White circles) DLS titration curves of PAA28-co-PAPEO22 with P2MVPI43 (a) and PAH·HCl160 (b) in 1 mM NaCl, pH 7, (black circles) zeta potentials of GIC-PAPEO22/P2MVPI43 (a) and GIC-PAPEO22/PAH160 (b) measured at various mixing ratios (Emphasis>)) in 1 mM NaCl, pH 7. Lines were added to guide the eye. Instruments settings for DLS titrations, namely the aperture of the detector (pinhole), were different for titration with P2MVPI43 and PAH·HCl160. For titration with P2MVPI43, the aperture was 200 μm and for titration with PAH·HCl160 the aperture was 400 μm. The pinhole size was increased to improve the signal measured for weakly scattering PAA28-co-PAPEO22 + PAH·HCl160 complexes

