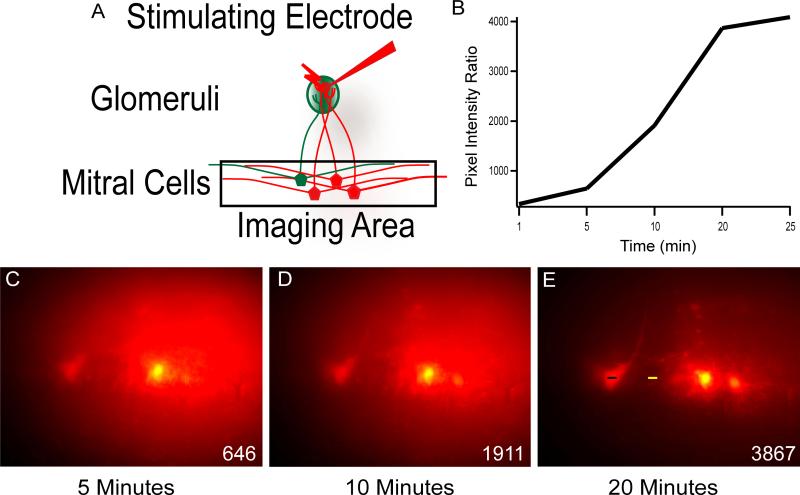
Figure 4. Rapid Uptake and Diffusion of Dye.
A) Schematic illustrating the experimental design to observe and evaluate loading at various time intervals in the main olfactory bulb. The mitral cell layer was imaged after electroporating a single glomerulus. B) Graph of the ratio of pixel intensities measured at the soma divided by the background plotted against time after completion of the electroporation protocol. C-D) Fluorescent images of the mitral cell layer taken at 5, 10, and 20 minutes after electroporation of a glomerulus. Inset) The difference in pixel intensities between the cell body (black bar), and the surrounding tissue (yellow bar) was calculated for each time point.

