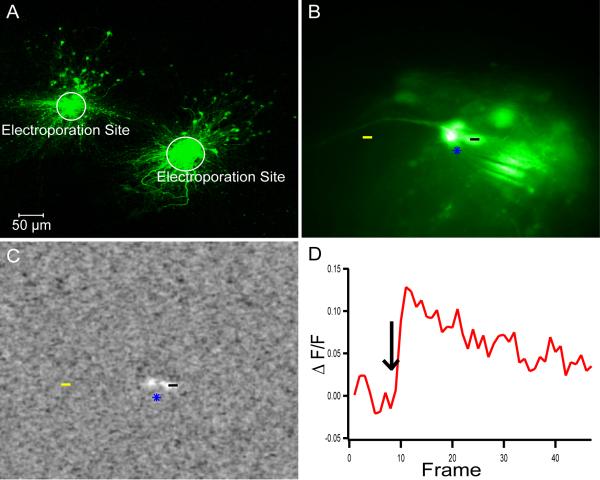
Figure 8. Calcium Activity in Local Neuronal Circuit.
A) Sagittal slices containing the accessory olfactory bulb were electroporated using Oregon Green Bapta in two separate locations in the mitral cells layer labeling both mitral cells and granule cells. B) Fluorescent image of a stimulating electrode (blue star) nearby several labeled mitral cells. C) Image stack of the average delta F/F at frame 11 during stimulation showing the increase in fluorescence of nearby mitral cells. D) The average delta F/F as a function of time calculated by subtracting the delta F/F of the background (yellow line) from the cell body (black line).

