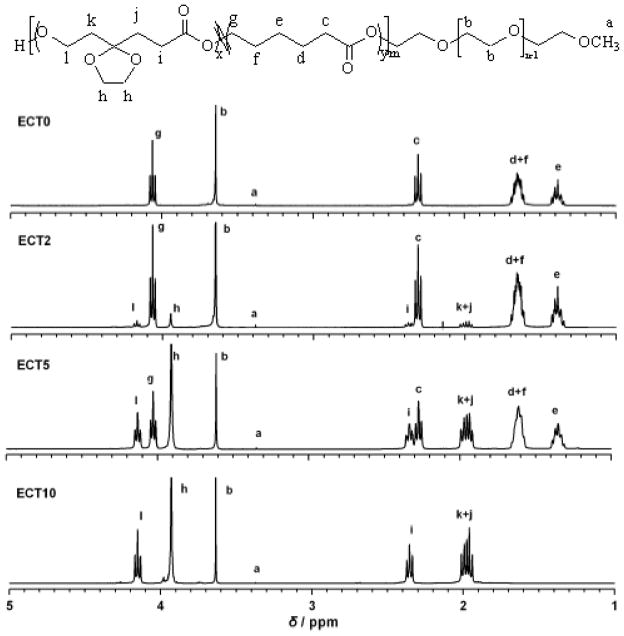
Figure 1.
1H NMR spectra of ECT copolymers with varying TSU content. Polymer composition and molecular weight were calculated by comparing integrals of characteristic peaks of the PEG blocks at 3.64 ppm and the typical protons for the monomers (3.95 ppm for TSU and 4.06 ppm for ε-CL). The molecular weight of PEG served as the reference.

