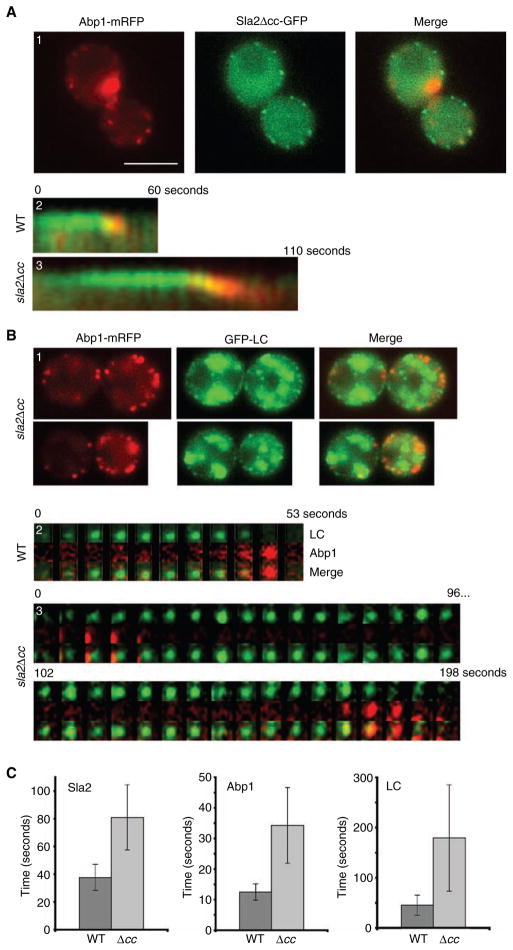
Figure 7. Sla2Δcc has increased Abp1, Sla2p and clathrin cortical patch lifetime.
(A) sla2Δcc-GFP ABP1-mRFP (SL5186) (A1 and A3) and SLA2-GFP ABP1-mRFP (SL5185) (A2) cells were visualized using wide-field microscopy. (A1) Single frame and (A2–A3) kymographs generated from single pixel lines through individual cortical patches collected from time-lapse videos at 2-second intervals. Note elongated patch lifetimes of cells expressing Sla2pΔcc and Abp1p. (B) sla2Δcc ABP1-mRFP GFP-CLC1 (SL5198) cells imaged using wide-field (B1) and TIRFM time-lapse at 6-second intervals (B3). (B2) WT ABP1-mRFP GFP-CLC1 (SL5090) cells imaged using TIRFM at 5.3-second intervals. (C) Bar graphs showing the average patch lifetimes for Sla2p-GFP, Abp1p-mRFP and GFP-LC in WT and sla2Δcc cells. Note dramatic increase in patch lifetimes in the sla2Δcc mutant (p < 0.001 for all). Scale bar = 5 μm.

