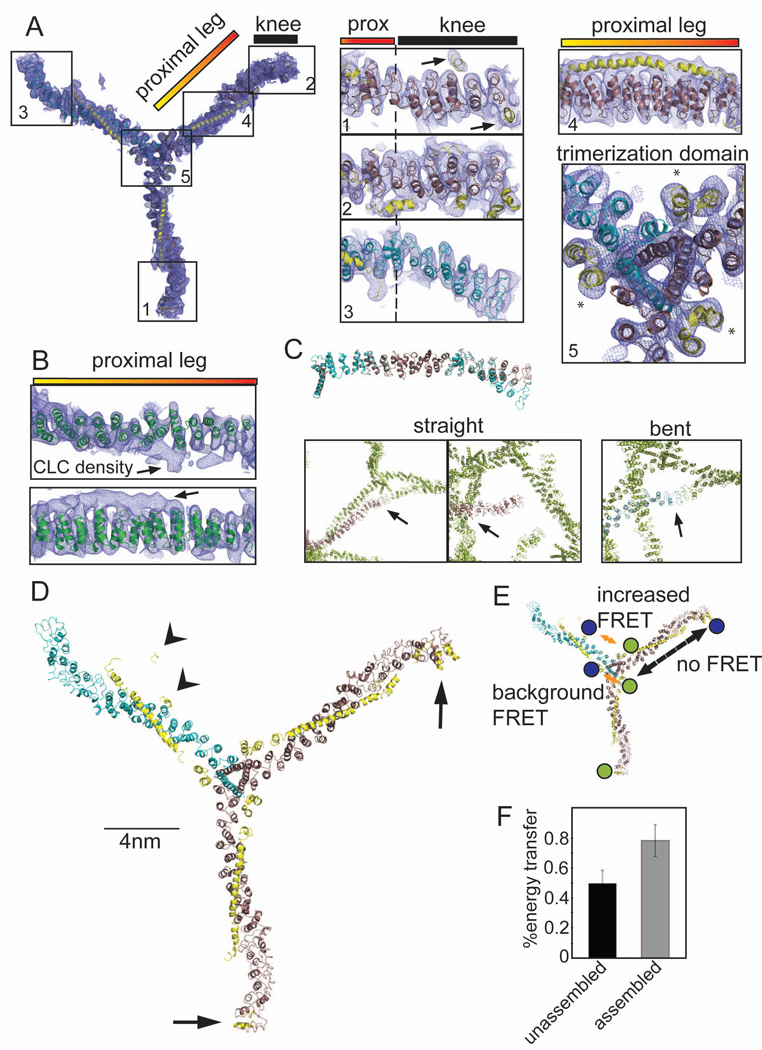
Figure 1. 7.9 Å resolution electron density of the clathrin hub-LCb complex and conformational variability of clathrin light chains.
(A) Model of the hub-LCb complex determined by X-ray crystallography with 2Fo-Fc electron density (0.06e/A3, 1.2σ, blue mesh). Details are shown in numbered boxes indicating the regions. Regions 1 and 2 show CHC straight knee conformations (brown ribbons) and region 3 shows the CHC bent knee conformation (blue ribbons), N-terminal to the proximal (prox) leg. CLC residues are shown as yellow ribbons and highlighted by arrows in region 1. Asterisks in region 5 (trimerization domain) indicate helices from the C-terminus of CLC that make contacts with two different CHCs. (B) The high resolution structure of the clathrin heavy chain proximal leg (1B89, green ribbon, Ybe et al., 1999) fitted into the 2Fo-Fc electron density from the proximal leg region. Arrows point to density corresponding to CLC. (C) Straight (brown ribbons) or bent (blue ribbons) legs from the 7.9 Å, spacegroup I4122 structure were aligned with each other in PYMOL. Boxes show contacts between crystal symmetry-mates (green) surrounding the N-terminus of straight or bent legs, colored as above. Arrows point to areas of symmetry-mate contact closest to the N-terminus of each leg. (D) Structural model of the clathrin hub-LCb complex. CHC helices are in brown (straight conformation) and blue (bent conformation) and CLC is in yellow. CLC extends from the trimerization domain to the knee region on two legs with straight knees (arrows) while on the bent leg CLC forms a more compact structure in the N-terminal region (arrowheads). (E) Diagram indicating the possible FRET interactions and the locations of the fluorescent dyes in blue and green. Orange arrows indicate distances favorable for FRET between two clathrin light chains (background at the trimerization domain or between termini of clathrin light chains). Dashed black arrow indicates a distance unfavorable for FRET. (F) CLC labeled randomly with two different fluorophores was bound to clathrin hub and these complexes were mixed with complexes of hub with unlabeled CLC to prevent intermolecular energy transfer (as determined in Figure S1D). FRET was measured in either the unassembled or the assembled state. Each bar represents the mean ±SEM (n=3).

