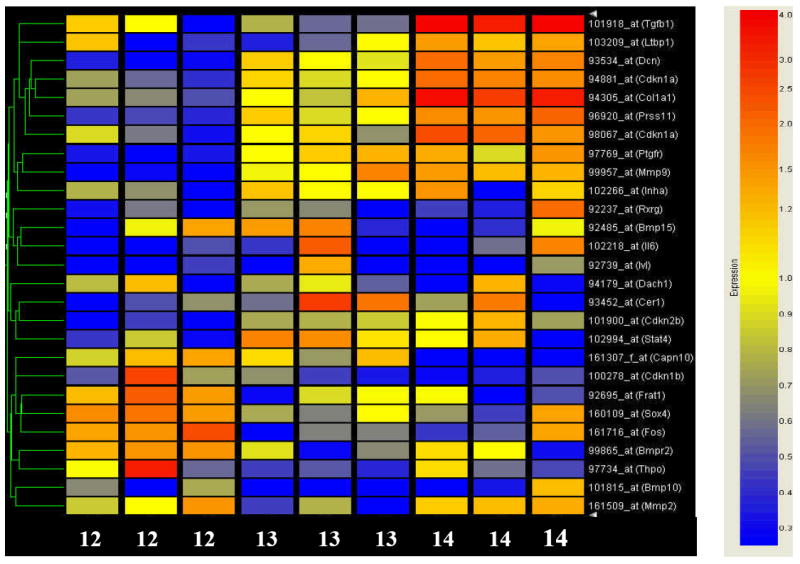
Figure 2. Heat map illustrating the statistically significant alterations in expression of the TGFß superfamily of genes during murine orofacial development.

Each row of the heat map represents a gene, and each column represents a time point in development (gestational day labeled along the bottom). The color saturation represents the level of gene expression. Red indicates an increase in gene expression, whereas blue indicates a decrease. Genes whose expression demonstrated a two-fold or greater increase or decrease are depicted. The list of genes comprising the heat map is listed in Table 2.
