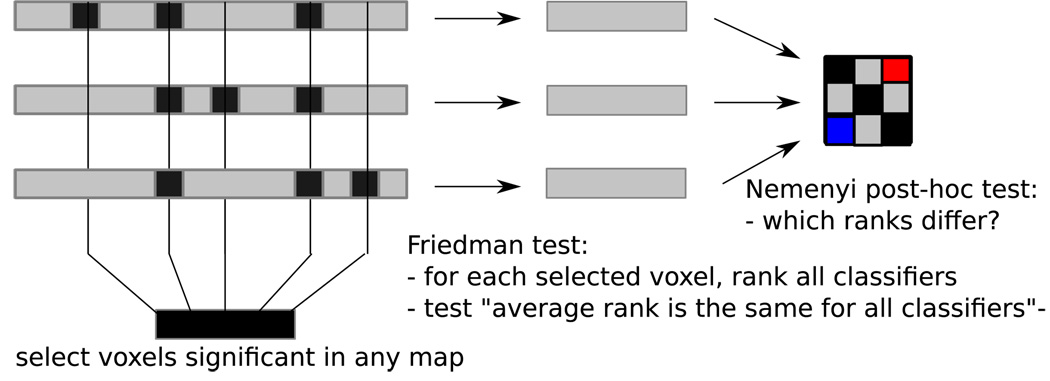
Figure 10.
In order to compare multiple accuracy maps, their maps of p-values are thresholded with FDR (q = 0.01 and the set of voxels significant in any map is identified (left). Each pair of accuracy maps is compared across that set of voxels, using a Friedman test (center). If the test rejects the null hypothesis that no pairs are different, a post-hoc Nemenyi test is conducted to identify which pairs are (right).

