Fig. 4.
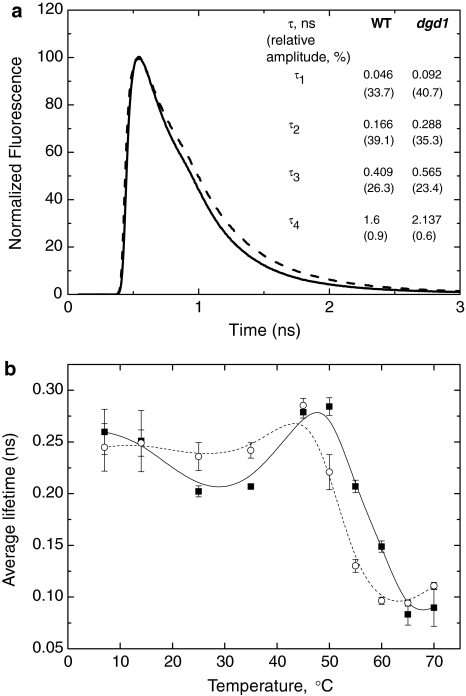
a Chlorophyll a fluorescence decay traces for isolated thylakoid membranes from WT (thick line) and dgd1 (dashed line), recorded by TCSPC. The presented curves are the sums of five independent measurements on different preparations. The excitation wavelength is 430 nm, and the emission is recorded at 688 nm at 25°C. The corresponding fits (fluorescence lifetimes (τ) and relative amplitudes, given in brackets) are also presented. b Temperature dependence of the average fluorescence lifetime for the WT (filled square) and dgd1 (open circle). Details about the fitting procedure are described in “Materials and methods”. The lines (solid for WT and dashed for dgd1) serve as a guide to the eye. The average lifetime values and their standard errors are determined from five independent experiments

