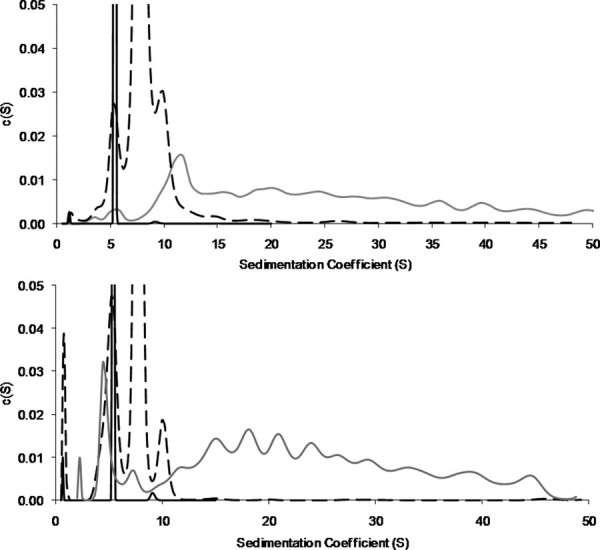
Figure 5.

SV-AUC data for antiSA1 (top panel) and antiSA2 (bottom) fractions. The monomer (solid black) and oligomer (dashed black) are similar between the subclasses, while there are differences in the heterogeneity of the aggregates (solid gray). More distinct species are visible in the antiSA2 aggregate.
