
Figure 7.
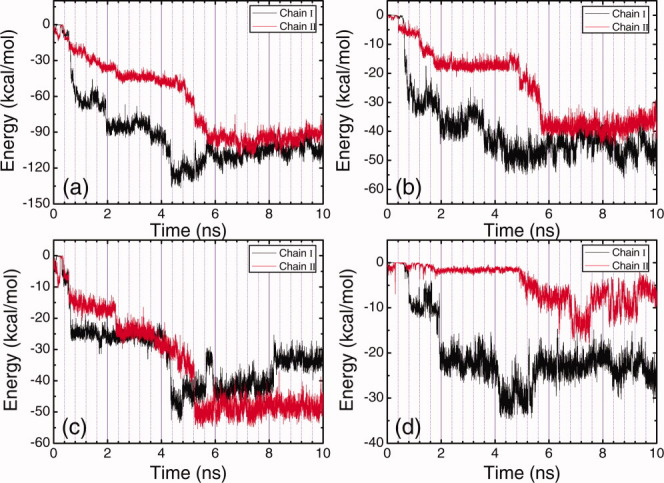
Time evolution plots of the total energy of each peptide molecule with HOPG surface (a), the energy of alanine residues in each peptide molecule with HOPG surface (b), the energy of lysine residues in each peptide molecule with HOPG surface (c), and the energy of glutamic acid residues in each peptide molecule with HOPG surface (d) under basic condition. [Color figure can be viewed in the online issue, which is available at wileyonlinelibrary.com.]