
Figure 9.
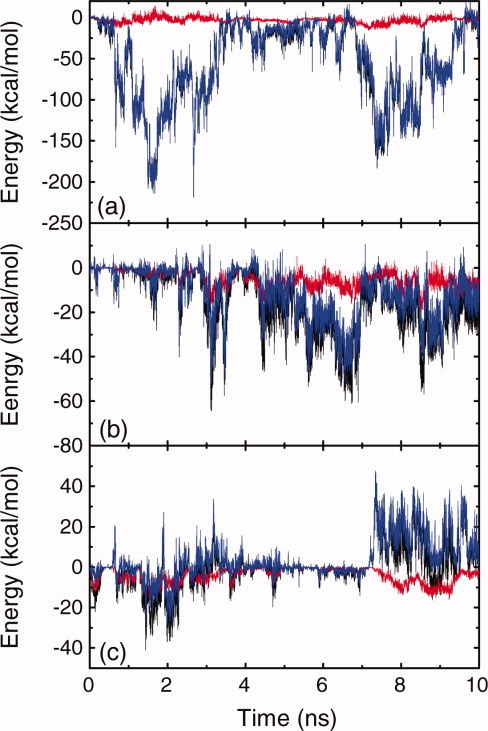
Time evolution of the total energy (black lines), the vdW energy (red lines), and the electrostatic energy (blue lines) between the two peptide molecules under neutral condition (a), acidic condition (b), and basic condition (c), respectively. [Color figure can be viewed in the online issue, which is available at wileyonlinelibrary.com.]