
Figure 3.
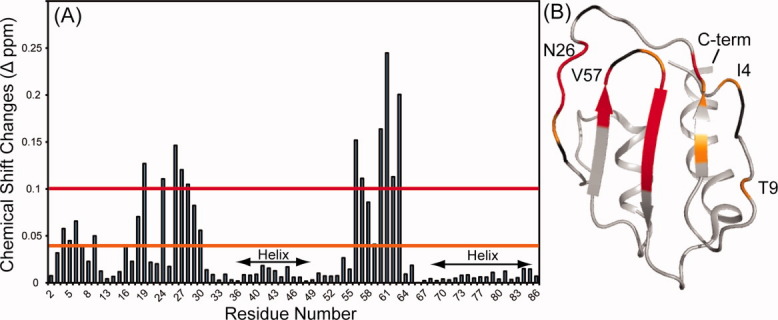
(A) The combined 15N and 1H chemical shifts perturbations of each resonance for SeR13 between 0.1 and 2.1 mM. (B) The backbone of residues with amide chemical shift perturbations > 0.1 Δppm are shown in red (L19, N26, S27, F28, T29, Y56, D59, F60, I61, S62, and I63). The backbone of residues with amide chemical shift perturbations of < 0.1 but greater than 0.04 Δppm are shown in orange (I4, T9, K16, S18, T29 and D59). Residues that show chemical shifts changes but are overlapped with another crosspeaks are shown in black.