
Figure 6.
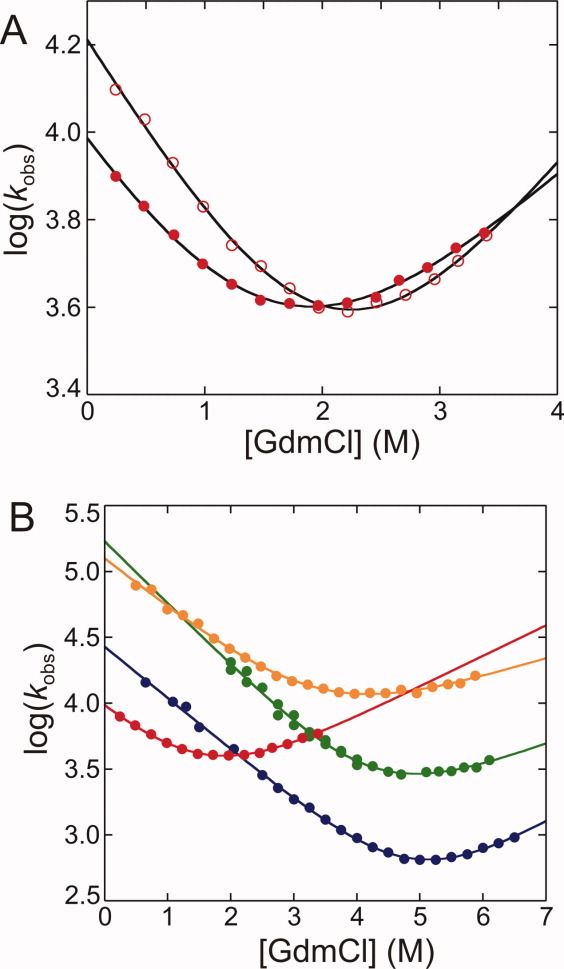
Chevron plots of HSBD-H142W and comparison with PSBD family members (T = 298 K). (A) Chevrons of HSBD recorded at pH 7.4 and 0.5 M (closed circles) and 1.0 M (open circles) ionic strength. (B) Chevron of HSBD at 0.5 M ionic strength (red) compared with data recorded from the bacterial homologues E3BD (blue, Ref.3), POB (green, Ref.3), and BBL (orange, Ref.10). Solid lines are data fits to a barrier-limited two-state folding model. [Color figure can be viewed in the online issue, which is available at wileyonlinelibrary.com.]