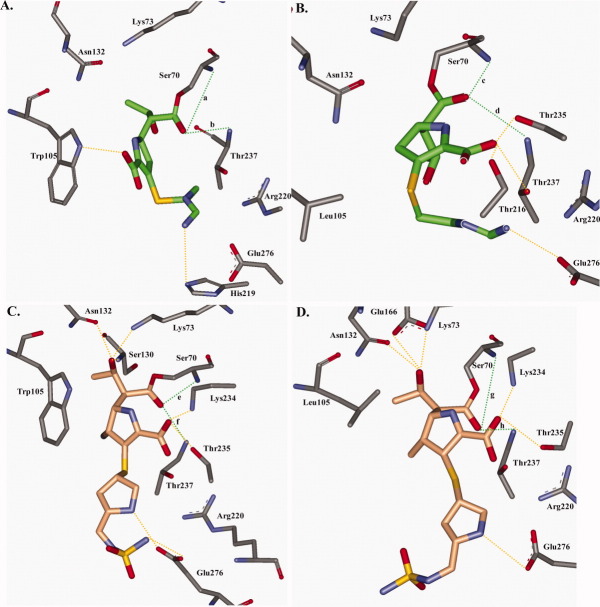
Figure 4.
Molecular representations with the lowest potential energy of a total of 50 frames after MDS for each β-lactamase-β-lactam complex are presented. All potential hydrogen bonds that occurred during MDS are denoted in yellow, except the hydrogen bonds between the carbapenem's carbonyl oxygen and backbone nitrogens of Ser70 and Thr237 which are denoted in green and are labeled a-h corresponding to designations presented in Figure 6. A. KPC-2 with imipenem (green); B. The Trp105Leu variant with imipenem (green); C. KPC-2 with doripenem (orange); D. The Trp105Leu variant with doripenem (orange).

