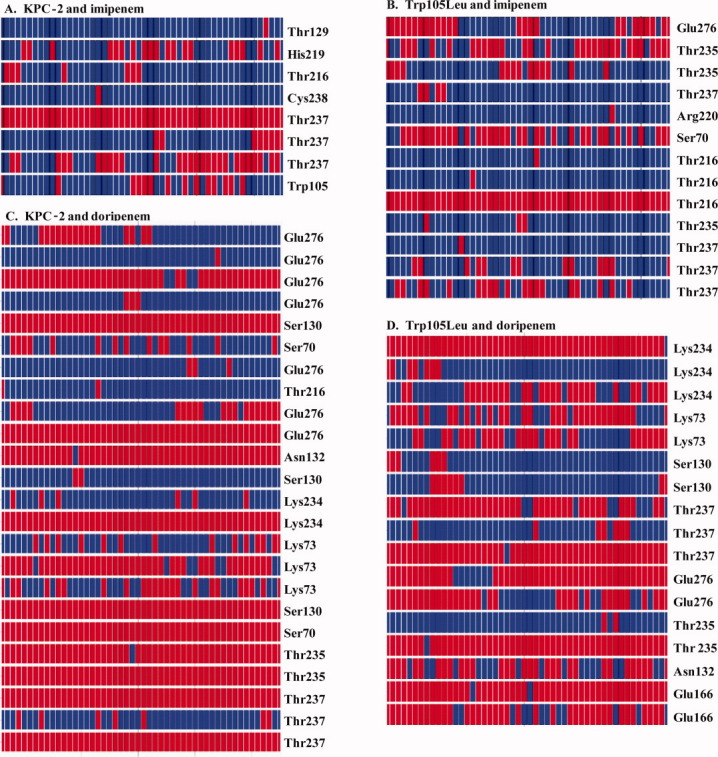
Figure 5.

Heat plots revealing the movement of all possible hydrogen bonding interactions during the trajectory between the β-lactam and β-lactamase (red denotes a hydrogen bond and blue denotes no hydrogen bond) A. KPC-2 and imipenem; B. Trp105Leu variant and imipenem; C. KPC-2 and doripenem; and D. Trp105Leu and doripenem.
