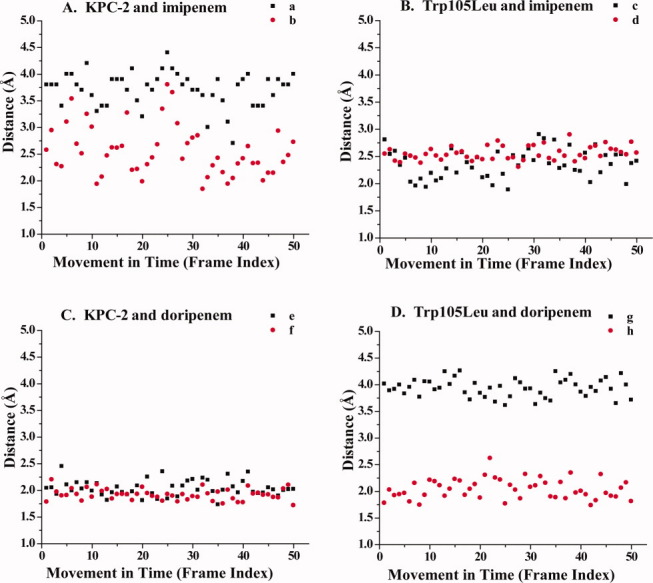
Figure 6.

Hydrogen bond distances in Å reveal the movement of the carbapenem's carbonyl oxygen between the backbone nitrogens of Ser70 (black) and Thr237 (red) during time. Letter designations (a–h) correspond to the hydrogen bonds present in Figure 4. A. KPC-2 and imipenem; B. Trp105Leu variant and imipenem; C. KPC-2 and doripenem; and D. Trp105Leu and doripenem.
